Genomic-prediction
Costa, W. G.
2025-03-25
Last updated: 2025-03-25
Checks: 6 1
Knit directory:
Genomic-prediction-through-machine-learning-and-neural-networks-for-traits-with-epistasis/
This reproducible R Markdown analysis was created with workflowr (version 1.7.1). The Checks tab describes the reproducibility checks that were applied when the results were created. The Past versions tab lists the development history.
The R Markdown file has unstaged changes. To know which version of
the R Markdown file created these results, you’ll want to first commit
it to the Git repo. If you’re still working on the analysis, you can
ignore this warning. When you’re finished, you can run
wflow_publish to commit the R Markdown file and build the
HTML.
Great job! The global environment was empty. Objects defined in the global environment can affect the analysis in your R Markdown file in unknown ways. For reproduciblity it’s best to always run the code in an empty environment.
The command set.seed(20220720) was run prior to running
the code in the R Markdown file. Setting a seed ensures that any results
that rely on randomness, e.g. subsampling or permutations, are
reproducible.
Great job! Recording the operating system, R version, and package versions is critical for reproducibility.
Nice! There were no cached chunks for this analysis, so you can be confident that you successfully produced the results during this run.
Great job! Using relative paths to the files within your workflowr project makes it easier to run your code on other machines.
Great! You are using Git for version control. Tracking code development and connecting the code version to the results is critical for reproducibility.
The results in this page were generated with repository version e71ae00. See the Past versions tab to see a history of the changes made to the R Markdown and HTML files.
Note that you need to be careful to ensure that all relevant files for
the analysis have been committed to Git prior to generating the results
(you can use wflow_publish or
wflow_git_commit). workflowr only checks the R Markdown
file, but you know if there are other scripts or data files that it
depends on. Below is the status of the Git repository when the results
were generated:
Ignored files:
    Ignored:    .Rproj.user/

Unstaged changes:
    Modified:   analysis/Genomic-prediction.Rmd
Note that any generated files, e.g. HTML, png, CSS, etc., are not included in this status report because it is ok for generated content to have uncommitted changes.
These are the previous versions of the repository in which changes were
made to the R Markdown (analysis/Genomic-prediction.Rmd)
and HTML (docs/Genomic-prediction.html) files. If you’ve
configured a remote Git repository (see ?wflow_git_remote),
click on the hyperlinks in the table below to view the files as they
were in that past version.
| File | Version | Author | Date | Message |
|---|---|---|---|---|
| Rmd | 16b1db0 | WevertonGomesCosta | 2025-03-24 | add setup knitr::opts_chunk$set(echo = T, warning = F) |
| Rmd | 3db9750 | WevertonGomesCosta | 2025-03-24 | update genomic-prediction.rmd |
| Rmd | 48e59c9 | WevertonGomesCosta | 2025-03-24 | add file Genomic-prediction |
Data
Data importantion
Listen files cross-validation
filesFenT <-
  list.files(path = pathFenT,
             pattern = "/*.txt",
             full.names = T)
filesFenV <-
  list.files(path = pathFenV,
             pattern = "/*.txt",
             full.names = T)
filesGenT <-
  list.files(path = pathGenT,
             pattern = "/*.txt",
             full.names = T)
filesGenV <-
  list.files(path = pathGenV,
             pattern = "/*.txt",
full.names = T)Analysis
Multivariate Adaptive Regression Splines (MARS)
Libraries
Carregando pacotes exigidos: FormulaCarregando pacotes exigidos: plotmoCarregando pacotes exigidos: plotrixCarregando pacotes exigidos: ggplot2Carregando pacotes exigidos: lattice
Anexando pacote: 'vip'O seguinte objeto é mascarado por 'package:utils':
vi── Attaching core tidyverse packages ──────────────────────── tidyverse 2.0.0 ──
✔ dplyr 1.1.4 ✔ readr 2.1.5
✔ forcats 1.0.0 ✔ stringr 1.5.1
✔ lubridate 1.9.4 ✔ tibble 3.2.1
✔ purrr 1.0.4 ✔ tidyr 1.3.1── Conflicts ────────────────────────────────────────── tidyverse_conflicts() ──
✖ dplyr::filter() masks stats::filter()
✖ dplyr::lag() masks stats::lag()
✖ purrr::lift() masks caret::lift()
ℹ Use the conflicted package (<http://conflicted.r-lib.org/>) to force all conflicts to become errorsMARS Processing
for(g in 1:grau) {
  cat("Grau: ", g, "\n")

  for (j in 1:nvariavel) {
    cat("Variavel: ", j, "\n")

    R2t <- matrix(nrow = nfolds, ncol = 1) #Objeto r? treinamento
    R2v <- matrix(nrow = nfolds, ncol = 1) #Objeto r? valida??o
    reqt <- matrix(nrow = nfolds, ncol = 1)#Objeto RQEM treinamento
    reqv <- matrix(nrow = nfolds, ncol = 1)#Objeto RQEM valida??o

    for (i in 1:nfolds) {
      dadosTy <- read.table(filesFenT[i])
      dadosTx <- read.table(filesGenT[i])
      dadosVy <- read.table(filesFenV[i])
      dadosVx <- read.table(filesGenV[i])

      cat("K-fold = ", i, "\n")

      for (k in c(threshi , seq(passot , threshf , by = passot))) {
        mars3 <-
          earth(
            x = dadosTx,
            y = dadosTy[, j],
            degree = g,
            thresh = k
          )

        ## Predi??o do modelo
        ypred <- predict(mars3, dadosVx)

        if (sd(ypred) == 0) {
          next
        }

        ##Par?metros do Modelo
        rv <- cor(ypred, dadosVy[, j])
        R2vk <- rv * rv

        if (k == threshi) {
          cat("Resultado para Variavel: ",
              j,
              " Grau: ",
              g,
              "Mudan?a em R?: ",
              k,
              "\n")
          R2v[i] <- R2vk
          best.mars <- mars3
          k1 <- k
          n1 <- n
        }

        if (R2vk > R2v[i]) {
          cat("Resultado para Variavel: ",
              j,
              " Grau: ",
              g,
              "Mudan?a em R?: ",
              k,
              "\n")
          R2v[i] <- R2vk
          best.mars <- mars3
          k1 <- k
        }
      }
      cat("Resultado para Variavel: ",
          j,
          " Grau: ",
          g,
          "Mudan?a em R?: ",
          k1,
          "\n")

      ## Par?metros do modelo Treinamento
      rt <- cor(best.mars$fitted.values, dadosTy[, j])
      R2t[i] <- rt * rt
      errot <- best.mars$fitted.values - dadosTy[, j]
      reqt[i] <- sqrt(mean(errot ^ 2))

      ## Par?metros do modelo Valida??o
      errov <- dadosVy[, j] - ypred
      reqv[i] <- sqrt(mean(errov ^ 2))
      coefc <- list(best.mars$coefficients)


      ## Import?ncia de marcadores
      imp <- evimp(best.mars, trim = FALSE)
      imp <- as.data.frame(unclass(imp[, c(1, 6)]))
      names <- cbind(imp$col, i)
      imp <- data.frame(imp$rss, names)
      colnames(imp) <- c("Overall", "marker", "n.fold")

      if (i == 1) {
        imp.mars3 <- imp
      } else {
        imp.mars3 <- imp.mars3 %>% rbind(imp)
      }

    }

    cat("Par?metros do modelo da variavel  ", j, "\n")
    par.mars3 <- cbind(R2t, R2v, reqt, reqv)
    par.mars3 <-
      rbind(par.mars3,
            apply(par.mars3, 2, mean),
            apply(par.mars3, 2, sd))
    colnames(par.mars3) <-
      c("R².Trein",     "R².Val",     "REQM.Trein",     "REQM.Val")
    rownames(par.mars3) <-
      c("K-Fold 1",
        "K-Fold 2",
        "K-Fold 3",
        "K-Fold 4",
        "K-Fold 5",
        "Mean",
        "SD")

    if (g == 1) {
      names <- cbind(rownames(par.mars3), "MARS L", j)
      namesi <- cbind("MARS L", rep(j, len = nrow(imp.mars3)))
    }
    if (g == 2) {
      names <- cbind(rownames(par.mars3), "MARS Q", j)
      namesi <- cbind("MARS Q", rep(j, len = nrow(imp.mars3)))
    }
    if (g == 3) {
      names <- cbind(rownames(par.mars3), "MARS C", j)
      namesi <- cbind("MARS C", rep(j, len = nrow(imp.mars3)))
    }

    colnames(names) <- c("n.fold", "method", "variable")
    par.mars3 <- data.frame(par.mars3, names)
    par.mars3

    colnames(namesi) <- c("method", "variable")
    imp.mars3 <- data.frame(imp.mars3, namesi)

    #Resultado de todas variaveis
    if (j == 1) {
      res.mars3 <- par.mars3
      res.imp.mars3 <- imp.mars3
    } else {
      res.mars3 <- res.mars3 %>% rbind(par.mars3)
      res.imp.mars3 <- res.imp.mars3 %>% rbind(imp.mars3)
    }

  }
  cat("Resultado final de todas variav?is para MARS", g, "\n")
  write.csv(res.mars3,  paste("res.mars", g, ".csv", sep = ""), row.names = FALSE)

  cat("Import?ncia de marcadores para todas variav?is do MARS", g, "\n")
  arq <- paste("res.imp.mars", g, ".RData", sep = "")
  save(res.imp.mars3,  file = arq)
}
Decision Tree - Continuous Response
Decision Tree Processing
for(j in 1:nvariable) {
  cat("==================================================== =======",
      "\n")
  cat("Results for for variable ", j, "\n")
  cat("==================================================== =======",
      "\n")
  R2t <- matrix(nrow = nfolds, ncol = 1) #Object r² training
  R2v <- matrix(nrow = nfolds, ncol = 1) #Object r² validation
  reqt <- matrix(nrow = nfolds, ncol = 1)# Training RQEM object
  reqv <- matrix(nrow = nfolds, ncol = 1)#RQEM validation object


  for (i in 1:nfolds) {
    dataTy <- read.table(filesFenT[i])
    dataTx <- read.table(filesGenT[i])
    dataVy <- read.table(filesFenV[i])
    dataVx <- read.table(filesGenV[i])

    # Fit a basic Decision Tree - Training

    cat("K-fold = ", i, "\n")
    fit_tree <- rpart(dataTy[, j] ~ . , data = dataTx)

    ## Model parameters
    rs = cor(dataTy[, j], predict(fit_tree))
    R2t[i] = rs * rs
    errort = predict(fit_tree) - dataTy[, j]
    reqt[i] = sqrt(mean(errort ^ 2))

    ## Importance of bookmarks
    imp <-
      data.frame(varImp(fit_tree, scale = TRUE, value = "rss"))

    names <- cbind(rownames(imp), i)
    colnames(names) <- c("marker", "n.fold")
    imp <- data.frame(imp, names)

    if (i == 1) {
      imp.ad <- imp
    } else {
      imp.ad <- imp.ad %>% rbind(imp)
    }

    # Validation

    ## Model prediction
    outputV = predict(fit_tree, newdata = dataVx)


    ## Model parameters
    rs = cor(dataVy[, j], outputV)
    R2v[i] = rs * rs
    errorv = dataVy[, j] - outputV
    reqv[i] = sqrt(mean(errorv ^ 2))
  }

  cat("Variable model parameters", j, "\n")
  par.ad <- cbind(R2t, R2v, reqt, reqv)
  par.ad <- rbind(par.ad, apply(par.ad, 2, mean), apply(par.ad, 2, sd))
  colnames(par.ad) <-
    c("R².Trein",     "R².Val",     "REQM.Trein",     "REQM.Val")
  rownames(par.ad) <-
    c("K-Fold 1",
      "K-Fold 2",
      "K-Fold 3",
      "K-Fold 4",
      "K-Fold 5",
      "Mean",
      "SD")
  names <- cbind(rownames(par.ad), "DT", j)
  colnames(names) <- c("n.fold", "method", "variable")
  par.ad <- data.frame(par.ad, names)
  par.ad

  # Result of all variables
  if (j == 1) {
    res.ad <- par.ad
  } else {
    res.ad <- res.ad %>% rbind(par.ad)
  }

  #Importance of all variable markers

  names <- cbind("DT", rep(j, len = nrow(imp.ad)))
  colnames(names) <- c("method", "variable")
  imp.ad <- data.frame(imp.ad, names)


  if (j == 1) {
    res.imp.ad <- imp.ad
  } else {
    res.imp.ad <- res.imp.ad %>% rbind(imp.ad)
  }
}

#cat("Final result of all variables for Decision Tree", "\n")
#res.ad
write.csv(res.ad, "output/res.ad.csv", row.names = FALSE)

#cat("Importance of markers for all decision tree variables", "\n")
#res.imp.ad
write.csv(res.imp.ad, "output/res.imp.ad.csv", row.names = FALSE)
Bagging
Load packages
randomForest 4.7-1.2Type rfNews() to see new features/changes/bug fixes.
Anexando pacote: 'randomForest'O seguinte objeto é mascarado por 'package:dplyr':
combineO seguinte objeto é mascarado por 'package:ggplot2':
marginBagging Processing
for(j in 1:nvariable) {
  cat("==================================================== =======",
      "\n")
  cat("Results for for variable ", j, "\n")
  cat("==================================================== =======",
      "\n")
  R2t <- matrix(nrow = nfolds, ncol = 1) #Object r² training
  R2v <- matrix(nrow = nfolds, ncol = 1) #Object r² validation
  reqt <- matrix(nrow = nfolds, ncol = 1)# Training RQEM object
  reqv <- matrix(nrow = nfolds, ncol = 1)#RQEM validation object

  for (i in 1:nfolds) {
    dataTy <- read.table(filesFenT[i])
    dataTx <- read.table(filesGenT[i])
    dataVy <- read.table(filesFenV[i])
    dataVx <- read.table(filesGenV[i])


    # Fit a basic Bagging - Training

    cat("K-fold = ", i, "\n")
    bag <-
      randomForest(dataTy[, j] ~ . , data = dataTx, mtry = ncol(dataTx))

    ## Model parameters
    rs = cor(dataTy[, j], predict(bag))
    R2t[i] = rs * rs
    errort = predict(bag) - dataTy[, j]
    reqt[i] = sqrt(mean(errort ^ 2))

    ## Importance of bookmarks
    imp <- data.frame(varImp(bag, scale = TRUE, value = "rss"))

    names <- cbind(rownames(imp), i)
    colnames(names) <- c("marker", "n.fold")
    imp <- data.frame(imp, names)

    if (i == 1) {
      imp.bag <- imp
    } else {
      imp.bag <- imp.bag %>% rbind(imp)
    }

    # Validation

    ## Model prediction
    outputV = predict(bag, newdata = dataVx)

    ## Model parameters
    rs = cor(dataVy[, j], outputV)
    R2v[i] = rs * rs
    errorv = dataVy[, j] - outputV
    reqv[i] = sqrt(mean(errorv ^ 2))
  }

  cat("Variable model parameters", j, "\n")
  par.bag <- cbind(R2t, R2v, reqt, reqv)
  par.bag <-
    rbind(par.bag, apply(par.bag, 2, mean), apply(par.bag, 2, sd))
  colnames(par.bag) <-
    c("R².Trein",     "R².Val",     "REQM.Trein",     "REQM.Val")
  rownames(par.bag) <-
    c("K-Fold 1",
      "K-Fold 2",
      "K-Fold 3",
      "K-Fold 4",
      "K-Fold 5",
      "Mean",
      "SD")
  names <- cbind(rownames(par.bag), "BA", j)
  colnames(names) <- c("n.fold", "method", "variable")
  par.bag <- data.frame(par.bag, names)
  par.bag

  # Result of all variables
  if (j == 1) {
    res.bag <- par.bag
  } else {
    res.bag <- res.bag %>% rbind(par.bag)
  }

  #Importance of all variable markers
  names <- cbind("BA", rep(j, len = nrow(imp.bag)))
  colnames(names) <- c("method", "variable")
  imp.bag <- data.frame(imp.bag, names)

  if (j == 1) {
    res.imp.bag <- imp.bag
  } else {
    res.imp.bag <- res.imp.bag %>% rbind(imp.bag)
  }
}
#cat("Final result of all variables for Bagging", "\n")
#res.bag
write.csv(res.bag, "output/res.bag.csv", row.names = FALSE)
#cat("Importance of markers for all Bagging variables", "\n")
#res.imp.bag
write.csv(res.imp.bag, "output/res.imp.bag.csv", row.names = FALSE)
Random Forest
Random Forest Processing
for(j in 1:nvariable) {
  cat("==================================================== =======",
      "\n")
  cat("Results for for variable ", j, "\n")
  cat("==================================================== =======",
      "\n")
  R2t <- matrix(nrow = nfolds, ncol = 1) #Object r² training
  R2v <- matrix(nrow = nfolds, ncol = 1) #Object r² validation
  reqt <- matrix(nrow = nfolds, ncol = 1)# Training RQEM object
  reqv <- matrix(nrow = nfolds, ncol = 1)#RQEM validation object

  for (i in 1:nfolds) {
    dataTy <- read.table(filesFenT[i])
    dataTx <- read.table(filesGenT[i])
    dataVy <- read.table(filesFenV[i])
    dataVx <- read.table(filesGenV[i])

    # Fit a basic Random Forest - Training

    cat("K-fold = ", i, "\n")
    rf <-
      randomForest(
        dataTy[, j] ~ . ,
        mytry = (ncol(dataTx) / 3),
        data = dataTx,
        ntree = 500
      )

    ## Model parameters
    rs = cor(dataTy[, j], predict(rf))
    R2t[i] = rs * rs
    errort = predict(rf) - dataTy[, j]
    reqt[i] = sqrt(mean(errort ^ 2))

    ## Importance of bookmarks
    imp <- data.frame(varImp(rf, scale = TRUE, value = "rss"))

    names <- cbind(rownames(imp), i)
    colnames(names) <- c("marker", "n.fold")
    imp <- data.frame(imp, names)

    if (i == 1) {
      imp.rf <- imp
    } else {
      imp.rf <- imp.rf %>% rbind(imp)
    }

    # Validation

    ## Model prediction
    outputV = predict(rf, newdata = dataVx)


    ## Model parameters
    rs = cor(dataVy[, j], outputV)
    R2v[i] = rs * rs
    errorv = dataVy[, j] - outputV
    reqv[i] = sqrt(mean(errorv ^ 2))
  }

  cat("Variable model parameters", j, "\n")
  par.rf <- cbind(R2t, R2v, reqt, reqv)
  par.rf <- rbind(par.rf, apply(par.rf, 2, mean), apply(par.rf, 2, sd))
  colnames(par.rf) <-
    c("R².Trein",     "R².Val",     "REQM.Trein",     "REQM.Val")
  rownames(par.rf) <-
    c("K-Fold 1",
      "K-Fold 2",
      "K-Fold 3",
      "K-Fold 4",
      "K-Fold 5",
      "Mean",
      "SD")
  names <- cbind(rownames(par.rf), "RF", j)
  colnames(names) <- c("n.fold", "method", "variable")
  par.rf <- data.frame(par.rf, names)
  par.rf

  # Result of all variables
  if (j == 1) {
    res.rf <- par.rf
  } else {
    res.rf <- res.rf %>% rbind(par.rf)
  }

  #Importance of all variable markers
  names <- cbind("RF", rep(j, len = nrow(imp.rf)))
  colnames(names) <- c("method", "variable")
  imp.rf <- data.frame(imp.rf, names)

  if (j == 1) {
    res.imp.rf <- imp.rf
  } else {
    res.imp.rf <- res.imp.rf %>% rbind(imp.rf)
  }
}

#cat("Final result of all variables for Random Forest", "\n")
#res.rf
write.csv(res.rf, "output/res.rf.csv", row.names = FALSE)
#cat("Importance of markers for all variables in Random Forest", "\n")
#res.imp.rf
write.csv(res.imp.rf, "output/res.imp.rf.csv", row.names = FALSE)
Boosting
Load packages
Loaded gbm 2.2.2This version of gbm is no longer under development. Consider transitioning to gbm3, https://github.com/gbm-developers/gbm3Boosting Processing
for(j in 1:nvariable) {
  cat("==================================================== =======",
      "\n")
  cat("Results for for variable ", j, "\n")
  cat("==================================================== =======",
      "\n")
  R2t <- matrix(nrow = nfolds, ncol = 1) #Object r² training
  R2v <- matrix(nrow = nfolds, ncol = 1) #Object r² validation
  reqt <- matrix(nrow = nfolds, ncol = 1)# Training RQEM object
  reqv <- matrix(nrow = nfolds, ncol = 1)#RQEM validation object

  for (i in 1:nfolds) {
    dataTy <- read.table(filesFenT[i])
    dataTx <- read.table(filesGenT[i])
    dataVy <- read.table(filesFenV[i])
    dataVx <- read.table(filesGenV[i])

    # Fit a basic Boosting - Training

    cat("K-fold = ", i, "\n")
    boost = gbm(
      dataTy[, j] ~ . ,
      data = dataTx,
      distribution = "gaussian",
      n.trees = 500 ,
      interaction.depth = 2
    )

    ## Model parameters
    output1 = predict(boost, dataTx, n.trees = 500)
    rs = cor(dataTy[, j], output1)
    R2t[i] = rs * rs
    errort = output1 - dataVy[, j]
    reqt[i] = sqrt(mean(errort ^ 2))

    ## Importance of bookmarks
    imp <-
      data.frame(varImp(
        boost,
        scale = TRUE,
        numTrees = 500,
        value = "rss"
      ))

    names <- cbind(rownames(imp), i)
    colnames(names) <- c("marker", "n.fold")
    imp <- data.frame(imp, names)

    if (i == 1) {
      imp.boost <- imp
    } else {
      imp.boost <- imp.boost %>% rbind(imp)
    }

    # Validation

    ## Model prediction
    outputV = predict(boost, newdata = dataVx, n.trees = 500)

    ## Model parameters
    rs = cor(dataVy[, j], outputV)
    R2v[i] = rs * rs
    errorv = outputV - dataVy[, j]
    reqv[i] = sqrt(mean(errorv ^ 2))
  }

  cat("Variable model parameters", j, "\n")
  par.boost <- cbind(R2t, R2v, reqt, reqv)
  par.boost <-
    rbind(par.boost, apply(par.boost, 2, mean), apply(par.boost, 2, sd))
  colnames(par.boost) <-
    c("R².Trein",     "R².Val",     "REQM.Trein",     "REQM.Val")
  rownames(par.boost) <-
    c("K-Fold 1",
      "K-Fold 2",
      "K-Fold 3",
      "K-Fold 4",
      "K-Fold 5",
      "Mean",
      "SD")
  names <- cbind(rownames(par.boost), "BO", j)
  colnames(names) <- c("n.fold", "method", "variable")
  par.boost <- data.frame(par.boost, names)
  par.boost

  # Result of all variables
  if (j == 1) {
    res.boost <- par.boost
  } else {
    res.boost <- res.boost %>% rbind(par.boost)
  }

  #Importance of all variable markers
  names <- cbind("BO", rep(j, len = nrow(imp.boost)))
  colnames(names) <- c("method", "variable")
  imp.boost <- data.frame(imp.boost, names)

  if (j == 1) {
    res.imp.boost <- imp.boost
  } else {
    res.imp.boost <- res.imp.boost %>% rbind(imp.boost)
  }
}
#cat("Final result of all variables for MARS Linear", "\n")
#res.boost
write.csv(res.boost,"output/res.boost.csv", row.names = FALSE)
#cat("Importance of markers for all MARS Linear variables", "\n")
write.csv(res.imp.boost,"output/res.imp.boost.csv", row.names = FALSE)
Genomic best linear unbiased prediction (G-BLUP)
Loading packages
Anexando pacote: 'MASS'O seguinte objeto é mascarado por 'package:dplyr':
selectG-BLUP Processing
for(j in 1:nvariable) {
  cat("==================================================== =======",
      "\n")
  cat("Results for for variable ", j, "\n")
  cat("==================================================== =======",
      "\n")
  R2t <- matrix(nrow = nfolds, ncol = 1) #Object r² training
  R2v <- matrix(nrow = nfolds, ncol = 1) #Object r² validation
  reqt <- matrix(nrow = nfolds, ncol = 1)# Training RQEM object
  reqv <- matrix(nrow = nfolds, ncol = 1)#RQEM validation object

  for (i in 1:nfolds) {
    dataTy <- read.table(filesFenT[i])
    dataTx <- read.table(filesGenT[i])
    dataVy <- read.table(filesFenV[i])
    dataVx <- read.table(filesGenV[i])

    # Fit a G-LUP model - Training

    cat("K-fold = ", i, "\n")
    gblup = kinship.BLUP(dataTy[, j], G.train = dataTx)

    ## Model parameters
    rs = cor(dataTy[, j], gblup$g.train)
    R2t[i] = rs * rs
    errort <- dataTy[, j] - gblup$g.train
    errort = errort - mean(errort)
    reqt[i] <- sqrt(mean(errort ^ 2))

    ## Importance of bookmarks
    # structuring genomic values in array to use sort
    gbv = as.matrix(gblup$g.train)

    # Marker effect vector
    dataTx = as.matrix(dataTx)
    effect.markers = ginv(t(dataTx) %*% dataTx) %*% (t(dataTx) %*% gbv)
    imp = as.data.frame(effect.markers)
    colnames(imp) <- "Overall"
    names <- cbind(colnames(dataTx), i)
    colnames(names) <- c("marker", "n.fold")
    imp <- data.frame(imp, names)

    if (i == 1) {
      imp.gblup <- imp
    } else {
      imp.gblup <- imp.gblup %>% rbind(imp)
    }

    # Validation

    ## Model prediction
    dataVx = as.matrix(dataVx)
    outputV = dataVx %*% effect.markers

    ## Model parameters
    rs = cor(dataVy[, j], outputV)
    R2v[i] = rs * rs
    errorv <- dataVy[, j] - outputV
    errorv = errorv - mean(errorv)
    reqv[i] <- sqrt(mean(errorv ^ 2))
  }

  cat("Variable model parameters", j, "\n")
  par.gblup <- cbind(R2t, R2v, reqt, reqv)
  par.gblup <-
    rbind(par.gblup, apply(par.gblup, 2, mean), apply(par.gblup, 2, sd))
  colnames(par.gblup) <-
    c("R².Trein",     "R².Val",     "REQM.Trein",     "REQM.Val")
  rownames(par.gblup) <-
    c("K-Fold 1",
      "K-Fold 2",
      "K-Fold 3",
      "K-Fold 4",
      "K-Fold 5",
      "Mean",
      "SD")
  names <- cbind(rownames(par.gblup), "G-BLUP", j)
  colnames(names) <- c("n.fold", "method", "variable")
  par.gblup <- data.frame(par.gblup, names)
  par.gblup

  # Result of all variables
  if (j == 1) {
    res.gblup <- par.gblup
  } else {
    res.gblup <- res.gblup %>% rbind(par.gblup)
  }

  #Importance of all variable markers
  names <- cbind("G-BLUP", rep(j, len = nrow(imp.gblup)))
  colnames(names) <- c("method", "variable")
  imp.gblup <- data.frame(imp.gblup, names)


  if (j == 1) {
    res.imp.gblup <- imp.gblup
  } else {
    res.imp.gblup <- res.imp.gblup %>% rbind(imp.gblup)
  }
}

#cat("Final result of all variables for G-BLUP", "\n")
write.csv(res.gblup,"output/res.gblup.csv", row.names = FALSE)
#
#cat("Importance of markers for all G_BLUP variables", "\n")
#res.imp.gblup
write.csv(res.imp.gblup,"output/res.imp.gblup.csv", row.names = FALSE)
Radial Base Network
Loading results obtained in the Genes Software. Scripts can be seen here
Multilayer Perceptron Network
Loading results obtained in the Genes Software. Scripts can be seen here
Results
Organizing results
result <-
  rbind(res.mars1,
        res.mars2,
        res.mars3,
        res.ad,
        res.bag,
        res.rf,
        res.boost,
        res.gblup,
        res.rbf,
        res.mlp)

colnames(result) <-
  c("R².Trein",
    "R².Val",
    "REQM.Trein",
    "REQM.Val",
    "n.fold",
    "method",
    "variable")

result <- result %>%
  mutate(
    variable = as.numeric(variable),
    method = as.factor(method),
    method = fct_relevel(method, c("BA", "BO",  "DT", "G-BLUP",  "MARS L", "MARS Q", "MARS C", "MLP", "RBF", "RF")),
    method = fct_recode(method, "MARS 1" = "MARS L", "MARS 2" = "MARS Q", "MARS 3" = "MARS C"),
    n.fold = as.factor(str_replace(n.fold, c("-", " "), "")),
    herd = as.factor(
      case_when(
        variable <= 6 ~ "30 %",
        variable > 6 & variable < 13 ~ "50 %",
        variable >= 13 ~ "80 %"
      )
    ),
    ngenes = as.factor(
      case_when(
        variable == 1 | variable == 7 | variable == 13 ~ 8,
        variable == 2 | variable == 8 | variable == 14 ~ 40,
        variable == 3 | variable == 9 | variable == 15 ~ 80,
        variable == 4 | variable == 10 | variable == 16 ~ 120,
        variable == 5 | variable == 11 | variable == 17 ~ 240,
        variable == 6 | variable == 12 | variable == 18 ~ 480
      )
    )
  )

result_final <- result %>%
  group_by(ngenes, herd, method) %>%
  filter(n.fold != "Mean" & n.fold != "SD") %>%
  summarise(
    R2.mean = mean(`R².Val`) * 100,
    REQM.mean = mean(REQM.Val) * 100,
    R2.sd = sd(`R².Val`) * 100,
    REQM.sd = sd(REQM.Val) * 100
  ) %>%
  ungroup()

result_final <- result_final %>%
  mutate(family = factor(
    case_when(
      method == "MARS 1" |
        method == "MARS 2" | method == "MARS 3" ~ "MARS",
      method == "DT" |
        method == "RF" | method == "BA" | method == "BO" ~ "TREE",
      method == "G-BLUP" ~ "G-BLUP",
      method == "RBF" | method == "MLP" ~ "NETWORK"
    )))

write.csv(result_final,"output/result.final.csv", row.names = FALSE)
Ploting results
Acuracy selective
library(ggthemes)

h_line <- result_final %>%
  group_by(ngenes, herd) %>%
  summarise(mediar2 = mean(R2.mean),
            mediareqm = mean(REQM.mean))
`summarise()` has grouped output by 'ngenes'. You can override using the
`.groups` argument.result_final %>%
mutate(varnames = fct_reorder2(method, R2.mean, family)) %>%
ggplot(aes(x = varnames, y = R2.mean, fill = family)) +
geom_col(alpha = 0.8, width = 0.85) +
geom_point(colour = "#FC4E07",show.legend = FALSE) +
geom_errorbar(
aes(ymin = R2.mean - R2.sd, ymax = R2.mean + R2.sd),
width = .2,
position = position_dodge(.9)
) +
scale_x_discrete(expand = expansion(add = 1)) +
scale_y_continuous(
limits = c(0, 100),
expand = c(0, 0),
breaks = scales::breaks_width(10)
) +
geom_hline(
data = h_line,
aes(yintercept = mediar2),
linetype = "dashed",
colour = "red"
) +
facet_grid(herd ~ ngenes) +
theme_classic() +
theme(
axis.text.x = element_text(angle = 60, hjust = 1),
text = element_text(size = 12),
panel.spacing = unit(1, "lines"),
legend.position = "top"
) +
labs(y = "R² (%)", x = "", fill = "") +
scale_fill_gdocs()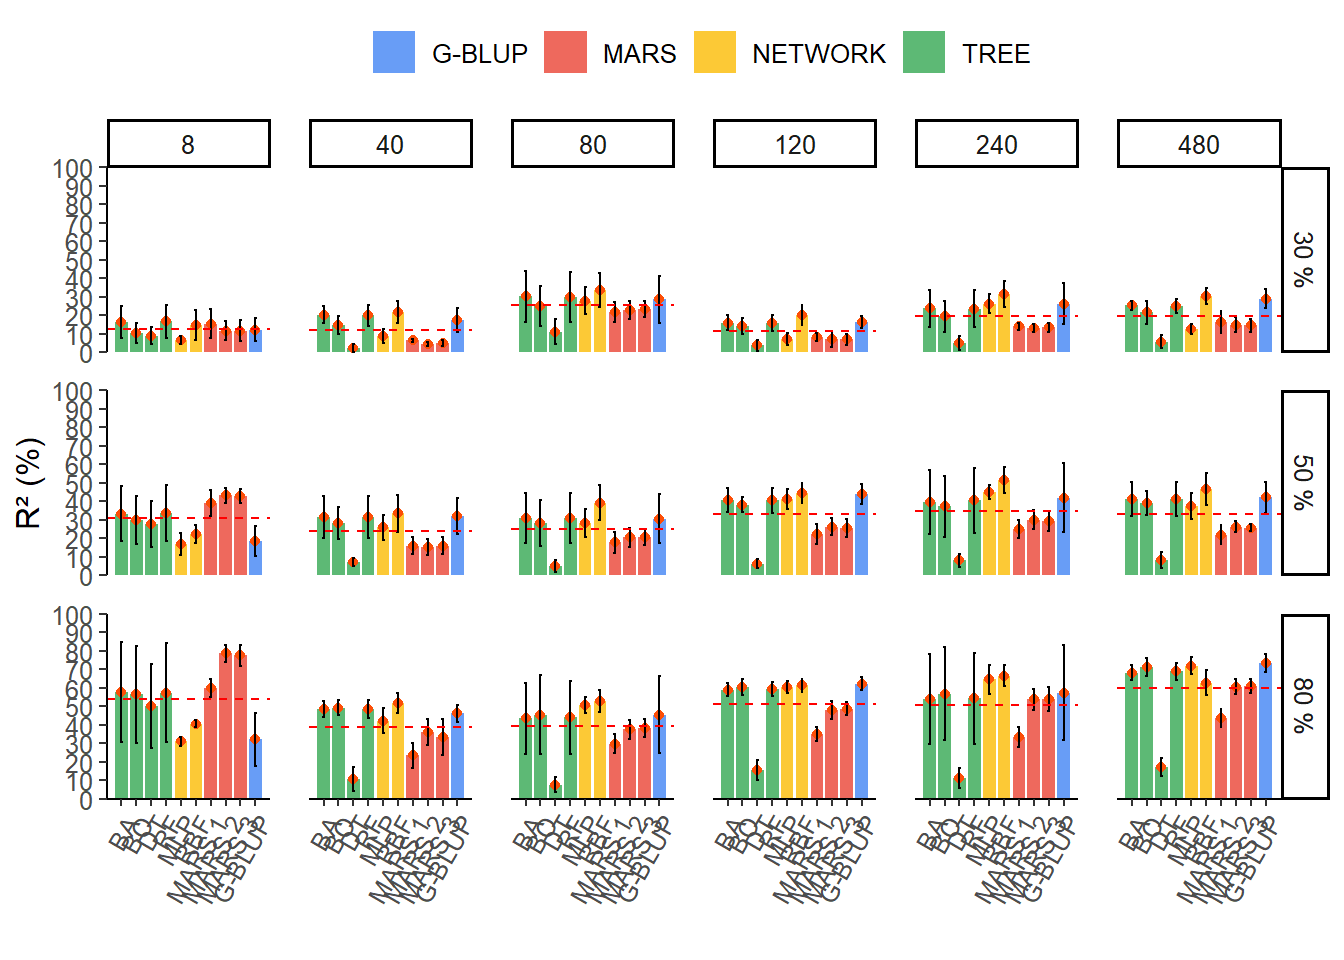
Acuracy predtive
result_final %>%
  mutate(varnames = fct_reorder2(method, REQM.mean, family)) %>%
  ggplot(aes(x = varnames, y = REQM.mean, fill = family)) +
  geom_col(alpha = 0.8, width = 0.85) +
  geom_point(colour = "#FC4E07",show.legend = FALSE) +
  geom_errorbar(
    aes(ymin = REQM.mean - REQM.sd, ymax = REQM.mean + REQM.sd),
    width = .2,
    position = position_dodge(.9)
  ) +
  scale_x_discrete(expand = expansion(add = 1)) +
  geom_hline(
    data = h_line,
    aes(yintercept = mediareqm),
    linetype = "dashed",
    colour = "red"
  ) +
  facet_grid(herd ~ ngenes, scales = "free") +
  theme_classic() +
  theme(
    axis.text.x = element_text(angle = 60, hjust = 1),
    text = element_text(size = 12),
    panel.spacing = unit(1, "lines"),
    legend.position = "top"
  ) +
  labs(y = "RMSE", x = "", fill =  "") +
  scale_fill_gdocs() +
  ylim(0,420)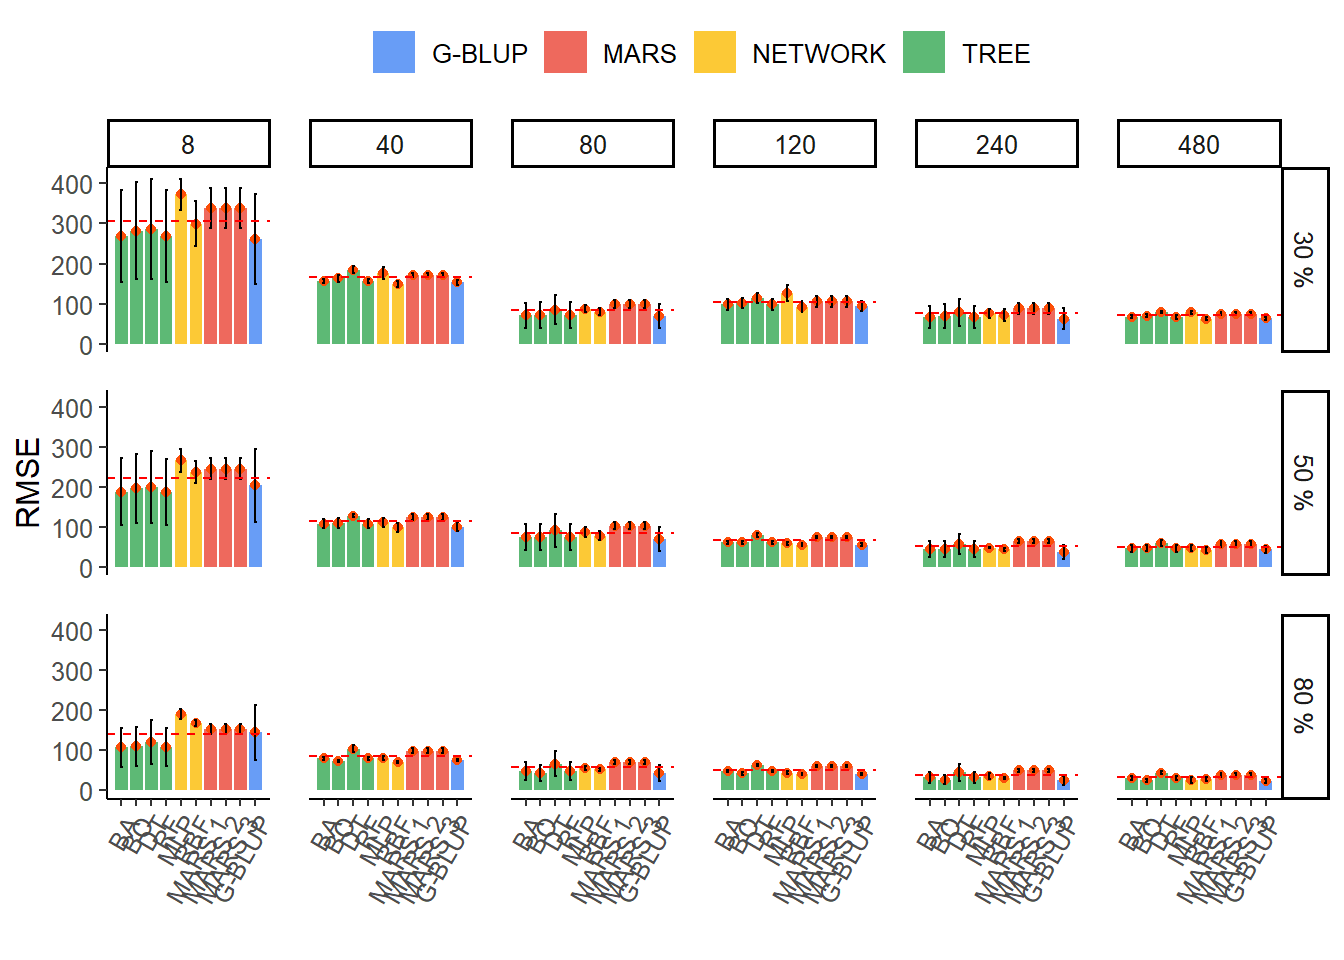
R version 4.4.3 (2025-02-28 ucrt)
Platform: x86_64-w64-mingw32/x64
Running under: Windows 11 x64 (build 26100)

Matrix products: default


locale:
[1] LC_COLLATE=Portuguese_Brazil.utf8  LC_CTYPE=Portuguese_Brazil.utf8
[3] LC_MONETARY=Portuguese_Brazil.utf8 LC_NUMERIC=C
[5] LC_TIME=Portuguese_Brazil.utf8

time zone: America/Sao_Paulo
tzcode source: internal

attached base packages:
[1] stats     graphics  grDevices utils     datasets  methods   base

other attached packages:
 [1] ggthemes_5.1.0       MASS_7.3-64          rrBLUP_4.6.3
 [4] gbm_2.2.2            randomForest_4.7-1.2 ISLR_1.4
 [7] rpart_4.1.24         lubridate_1.9.4      forcats_1.0.0
[10] stringr_1.5.1        dplyr_1.1.4          purrr_1.0.4
[13] readr_2.1.5          tidyr_1.3.1          tibble_3.2.1
[16] tidyverse_2.0.0      vip_0.4.1            caret_7.0-1
[19] lattice_0.22-6       ggplot2_3.5.1        earth_5.3.4
[22] plotmo_3.6.4         plotrix_3.8-4        Formula_1.2-5
[25] workflowr_1.7.1

loaded via a namespace (and not attached):
 [1] pROC_1.18.5          rlang_1.1.5          magrittr_2.0.3
 [4] git2r_0.35.0         compiler_4.4.3       getPass_0.2-4
 [7] callr_3.7.6          vctrs_0.6.5          reshape2_1.4.4
[10] pkgconfig_2.0.3      fastmap_1.2.0        labeling_0.4.3
[13] promises_1.3.2       rmarkdown_2.29       prodlim_2024.06.25
[16] tzdb_0.4.0           ps_1.9.0             xfun_0.51
[19] cachem_1.1.0         jsonlite_1.9.1       recipes_1.1.1
[22] later_1.4.1          parallel_4.4.3       R6_2.6.1
[25] bslib_0.9.0          stringi_1.8.4        parallelly_1.42.0
[28] jquerylib_0.1.4      Rcpp_1.0.14          iterators_1.0.14
[31] knitr_1.49           future.apply_1.11.3  httpuv_1.6.15
[34] Matrix_1.7-2         splines_4.4.3        nnet_7.3-20
[37] timechange_0.3.0     tidyselect_1.2.1     rstudioapi_0.17.1
[40] yaml_2.3.10          timeDate_4041.110    codetools_0.2-20
[43] processx_3.8.6       listenv_0.9.1        plyr_1.8.9
[46] withr_3.0.2          evaluate_1.0.3       future_1.34.0
[49] survival_3.8-3       pillar_1.10.1        whisker_0.4.1
[52] foreach_1.5.2        stats4_4.4.3         generics_0.1.3
[55] rprojroot_2.0.4      hms_1.1.3            munsell_0.5.1
[58] scales_1.3.0         globals_0.16.3       class_7.3-23
[61] glue_1.8.0           tools_4.4.3          data.table_1.17.0
[64] ModelMetrics_1.2.2.2 gower_1.0.2          fs_1.6.5
[67] grid_4.4.3           ipred_0.9-15         colorspace_2.1-1
[70] nlme_3.1-167         cli_3.6.4            lava_1.8.1
[73] gtable_0.3.6         sass_0.4.9           digest_0.6.37
[76] farver_2.1.2         htmltools_0.5.8.1    lifecycle_1.0.4
[79] hardhat_1.4.1        httr_1.4.7